



Comparative Market Analysis California: How to Value Your Home in 2026
Why does one online calculator value your Southern California home at $950,000 while another insists it’s only $820,000? It’s frustrating to see such a massive gap when you’re trying to plan your family’s next move. With the median home price in the state hitting a record $914,810 as of April 2026, getting the number right isn’t just a preference. It’s a financial necessity. A professional comparative market analysis California homeowners can actually trust requires more than just clicking a button on a website.
We understand the anxiety that comes with a 6.52% interest rate environment and the confusion of picking the right “comps” in a tight market. You deserve a valuation that reflects the unique character of your property and the current local demand. This guide will help you master the art of property valuation so you can move forward with total clarity. We’ll show you how to verify sales history, select truly comparable properties, and interpret 2026 market trends to price your home with confidence.
Key Takeaways
- Learn why a professional comparative market analysis California is the essential “gold standard” for pricing your home accurately in a fast-moving market.
- Discover the specific hierarchy of adjustments professionals use to compare your home’s unique features against recently sold properties in your neighborhood.
- Gain the tools to access public records and MLS data to verify the true sales history and days on market for properties in Riverside or San Bernardino.
- Follow a clear, step-by-step process to define your home’s value drivers and select the most relevant “Sold” comps within a one-mile radius.
- Understand how local market intuition and bilingual outreach uncover critical “secret data” that automated online algorithms often miss.
What is a Comparative Market Analysis (CMA) in California?
A Comparative Market Analysis (CMA) is a detailed report that evaluates your home’s worth by comparing it to similar properties that recently sold in your immediate area. Think of it as a side-by-side look at your neighbors’ final sale prices to determine where your property fits in the current market. In the 2026 California real estate cycle, a CMA acts as a strategic roadmap that translates shifting buyer demand and record-high prices into a precise, competitive listing price. While an official appraisal is a formal process required by lenders to secure a mortgage, a realtor-led market analysis focuses on pricing strategy and market positioning. To better understand the foundations of property valuation, you can explore the broader principles of What is a Comparative Market Analysis (CMA) in California?.
Performing a comparative market analysis California homeowners can rely on is the gold standard for pricing in fast-moving markets like Riverside or Chino. It bridges the gap between what you think your home is worth and what a buyer is actually willing to pay. This process ensures you don’t leave money on the table or let your home sit on the market for longer than the state’s current 43-day average.
To see how these reports are built from the ground up, watch this helpful breakdown:
CMA vs. Automated Valuation Models (AVMs)
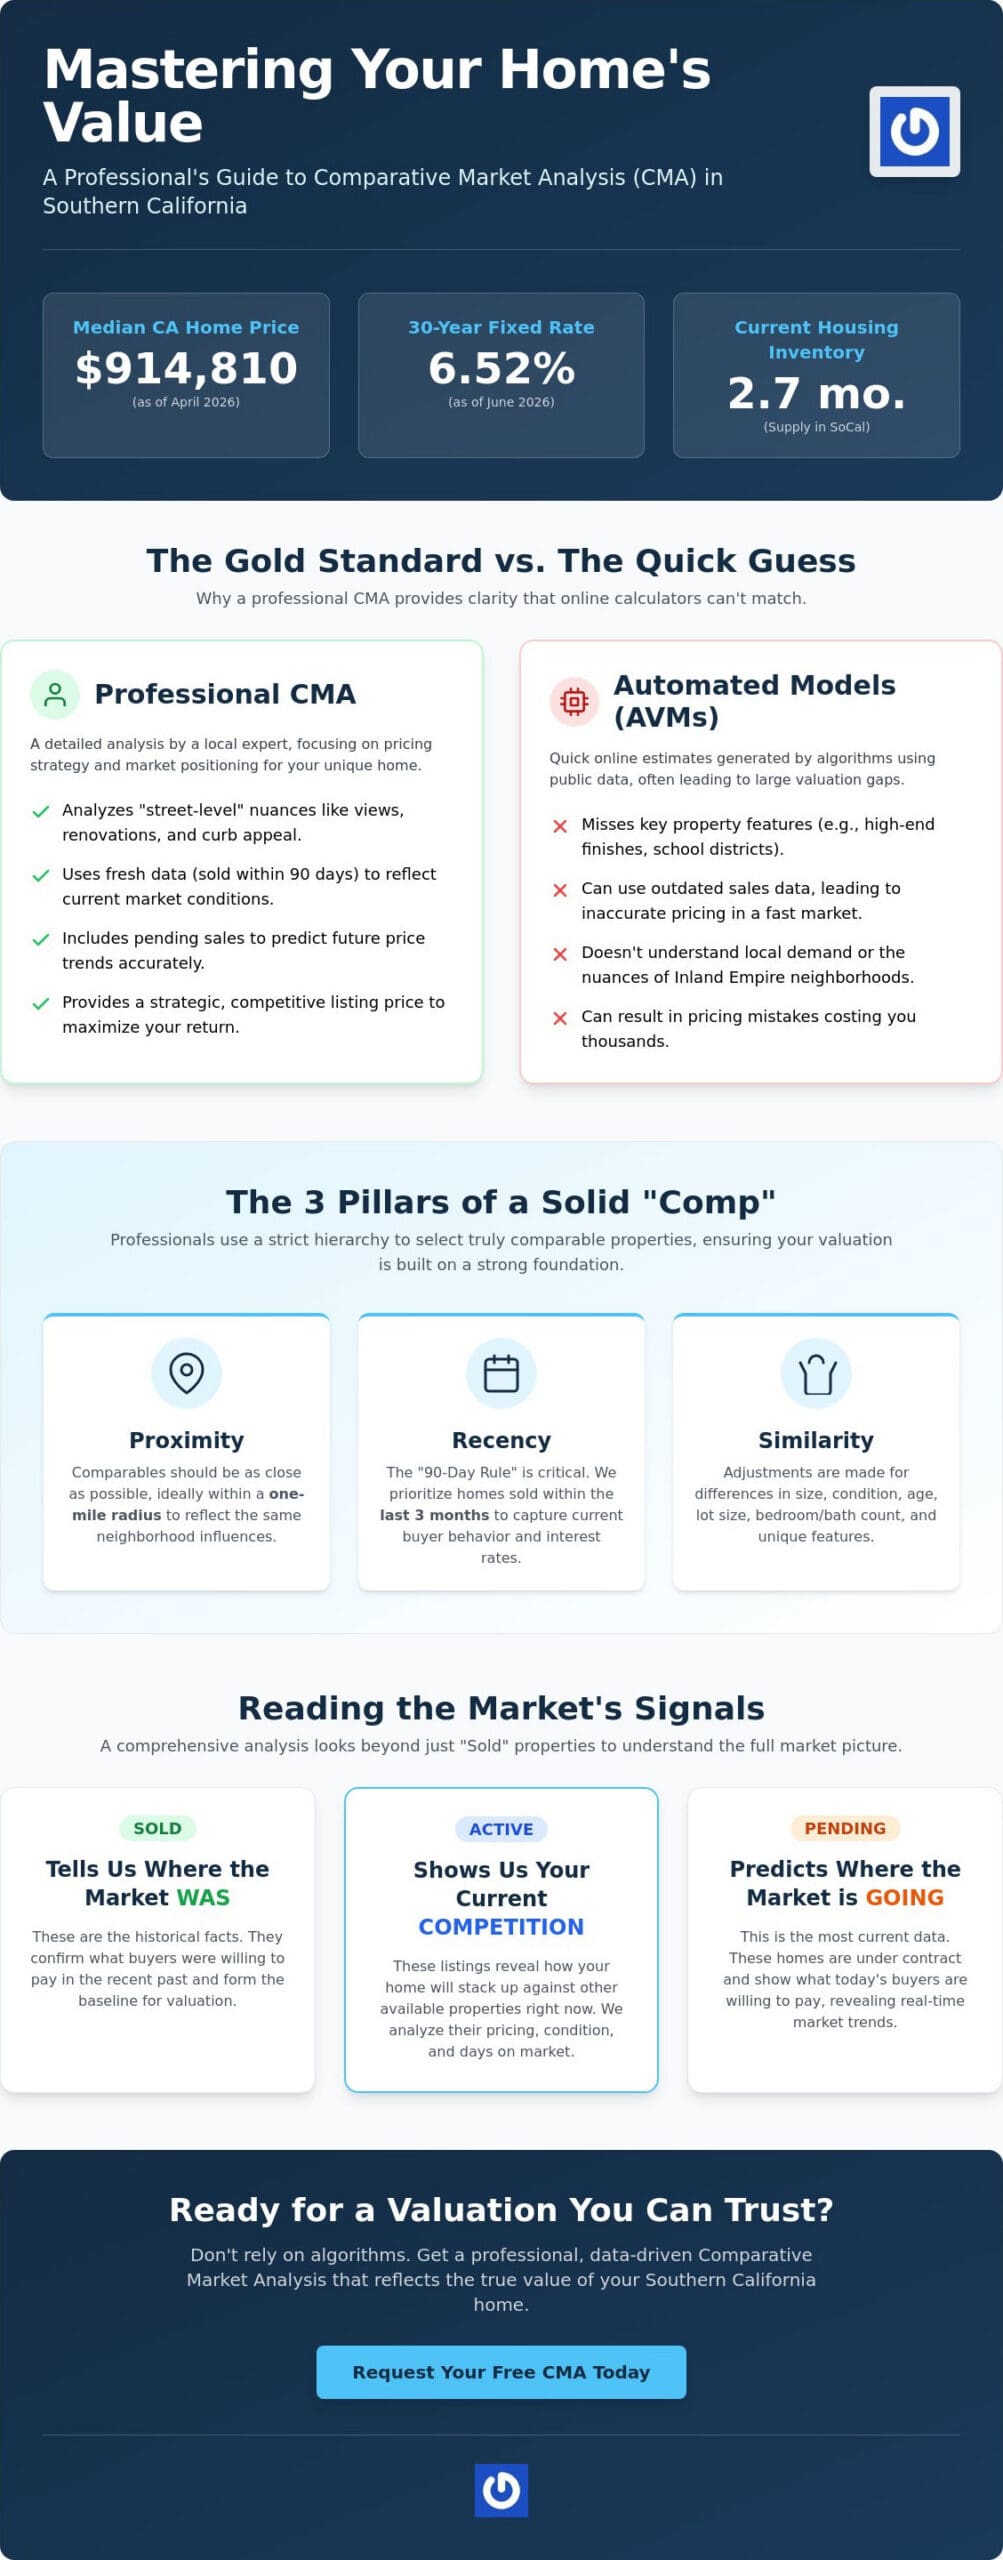
Algorithms are great for quick estimates, but they often fail in the diverse neighborhoods of the Inland Empire. A computer program doesn’t know if a home in Chino has a stunning mountain view or if a property in Riverside has been fully renovated with high-end finishes. When inventory is as low as 2.7 months, these automated estimates can be dangerously inaccurate. They miss the “street-level” nuances that only a human eye can catch. We adjust for property condition, local school boundary shifts, and even the curb appeal of the house next door. Relying on an algorithm in a market where the median price is $914,810 could lead to a pricing mistake that costs you thousands.
Why Timing Matters in the 2026 SoCal Market
Timing is everything in Southern California right now. With 30-year fixed mortgage rates sitting at 6.52% as of June 2026, buyer purchasing power changes almost weekly. This is why we stick to the 90-day rule. We prioritize homes that sold within the last three months to ensure the data is fresh. Older sales data can lead to overpricing because it doesn’t reflect the current inventory squeeze or the 4.2% rise in the Consumer Price Index. Using “comps” from six months ago is a recipe for a stagnant listing. You need data that reflects the reality buyers are facing today.
The Sales Comparison Approach: How Professionals Value Property
Valuing a home requires a specific lens. Professionals don’t just look at a single number. They look at the story told by similar properties. Using The Sales Comparison Approach: How Professionals Value Property allows us to compare your “Subject Property” against recent “Comparable Sales,” or comps. This isn’t just about finding homes with the same bedroom count. It involves a strict hierarchy of adjustments. We look at location, size, condition, and specific features to see how they influence value. Performing a professional comparative market analysis California homeowners can trust means ensuring every piece of data is accurate and relevant.
Integrity in data is vital. We prioritize “Arm’s Length Transactions,” which are sales between two unrelated parties. This excludes family transfers or distressed sales that don’t reflect true market value. While “Sold” listings tell us where the market was, we also analyze “Active” and “Pending” listings. Active homes represent your current competition. Pending sales are even more telling. They reveal what buyers are actually willing to pay right now in a market with only 2.7 months of inventory. This real-time data helps us predict future price trends before they hit the public records.
The Three Pillars of a Solid Comp
A reliable comp stands on three pillars: proximity, recency, and similarity. We stay within your specific neighborhood or school district boundaries. Crossing a major road can change a home’s value significantly. Recency is equally critical. In a landscape where interest rates sit at 6.52%, an accurate home value estimate Southern California must focus on the last 90 to 180 days. Finally, we match similarity. We look for homes that align with your square footage, lot size, and layout. This precision is a core component of a high-quality comparative market analysis California experts provide to ensure your price is competitive.
Adjusting for “The SoCal Premium”
In Southern California, specific features carry different weights depending on the zip code. A pool in Riverside County is often seen as a necessity, while in cooler coastal areas, it might not command the same premium. We also look at solar panels. An owned system adds clear value, but a leased system can sometimes complicate a sale. Location adjustments are the most nuanced. A quiet cul-de-sac location is worth more than a lot backing up to the 91, 15, or 60 freeways. We weigh these “SoCal Premiums” carefully to ensure your valuation is rooted in local reality. If you’re wondering how these factors apply to your specific street, we can help you navigate the details with a personalized home value estimate.
How to Track the Sales History of a Property
Understanding what a home is worth today requires looking at what happened yesterday. A comparative market analysis California relies heavily on the “paper trail” left by previous owners and agents. While the final sale price gets the headlines, the history behind that number reveals the true story of the property’s value. You need to know if a home sold quickly in a bidding war or if it languished on the market for months with multiple price drops. This detective work helps you separate a fluke sale from a genuine market trend.
The most reliable starting point is public record data found through county tax assessor websites. In Riverside and San Bernardino counties, the Assessor-County Clerk-Recorder portals provide a wealth of information on deed transfers and tax assessments. However, professionals also use the Multiple Listing Service (MLS) to see the “Days on Market” (DOM) and the history of failed listings. If a property was listed three times in two years without selling, that’s a clear signal that the market rejected the previous price or discovered a condition issue during inspections. Identifying “hidden” history like short sales or Real Estate Owned (REO) transactions is also vital. These sales often occur at a discount and can pull down neighborhood averages if you don’t account for their distressed nature.
Tools for DIY Sales History Research
- County Portals: Use the Riverside County Assessor-County Clerk-Recorder website to find the most recent grant deeds and property tax records.
- Third-Party Cross-Referencing: Sites like Zillow or Redfin are helpful for quick checks, but always verify their data against official county records to ensure accuracy.
- The Data Lag: Public records often lag behind the actual market by four to six weeks. A sale that closed yesterday might not show up in the assessor’s database until next month, making real-time MLS data much more valuable for a Step-by-Step: Performing Your Own Comparative Market Analysis.
Analyzing Price Trends Over Time
Looking at a five-year sales history helps you identify neighborhood appreciation rates. This long-term view allows you to spot “flipping” patterns where a home is bought, lightly renovated, and put back on the market within months. While this can increase local values, it can also create an artificial price bubble if the renovations don’t justify the jump. To verify if a recent sale was a distressed property or a standard sale, look for “Notice of Default” or “Substitute Trustee’s Deed” markers in the historical deed transfers. These indicators tell you the sale wasn’t a typical market transaction. By combining this historical context with a comparative market analysis California, you ensure your valuation is rooted in reality rather than just recent hype.
Step-by-Step: Performing Your Own Comparative Market Analysis
Creating a comparative market analysis California property owners can trust is a methodical process. It requires moving beyond the “one-click” estimates found on national portals. You need to look at the specific dirt and bricks of your neighborhood. Follow these five steps to build your own professional-grade report.
- Step 1: Define Value Drivers. Identify what makes your home stand out. Is it a three-car garage, a recently renovated kitchen, or a quiet cul-de-sac location? These are your primary value drivers.
- Step 2: Select 3-5 “Sold” Comps. Look for homes within a 1-mile radius that have sold in the last 90 days. This ensures your data matches the 2026 market reality where the median days on market is 43 days.
- Step 3: Add 2 “Active” Listings. These properties are your current competition. They show you what buyers are seeing right now and help you understand the current inventory levels.
- Step 4: Apply Dollar-Value Adjustments. If a comp has an extra bathroom, you might subtract $10,000 from its sale price to match your subject property. Adjust for square footage, lot size, and pool presence.
- Step 5: Reconcile the Data. Don’t look for a single magic number. Instead, identify a “Value Range” that reflects the high and low ends of the market for your specific home type.
Common Pitfalls in DIY CMAs
It’s easy to fall into the “Owner’s Bias” trap. You might feel that your custom-painted nursery or expensive landscaping adds dollar-for-dollar value. Unfortunately, buyers often view these as personal preferences rather than equity. Another mistake is ignoring the “Neighborhood Border” effect. Crossing a major street in Ontario or Chino can move you into a different school district or zip code; this fundamentally changes the property’s desirability. Avoid using “Outlier” sales, such as a home sold to a family member or a property that sat for 150 days due to poor condition. These don’t represent the broader market.
Refining the Range for 2026
Current inventory levels in Chino and Ontario remain tight, with only 2.7 months of supply. This low inventory can create a seller’s premium that isn’t always obvious in the raw data. We also look at the “Absorption Rate.” This tells us how many months it would take to sell all current listings if no new ones came on the market. If you feel stuck, consulting with a real estate agent in Temecula CA can help validate your findings and ensure your comparative market analysis California is spot on. For a professional second opinion on your numbers, you can request a detailed home value estimate today.
Why a Local Advocate Beats an Algorithm
An algorithm can’t explain why a neighbor’s house sold for $50,000 under market value. It sees a closing price but misses the “Secret Data” that only a local professional can uncover. Perhaps that low sale was a result of a foundation issue, a family transfer, or a seller in a rush to relocate. When we perform a comparative market analysis California sellers can rely on, we look past the raw numbers. We talk to other agents and dig into the context of every sale. This ensures your home isn’t unfairly compared to a property that had major hidden flaws.
Our team uses 15+ years of Inland Empire experience to do more than just find a price. We help you choose between “Pricing to Ignite” and “Pricing to Negotiate.” In a market where inventory is tight at 2.7 months, “Pricing to Ignite” often sparks a bidding war that drives the final sale price above the record $914,810 median. Once you have an offer, our job isn’t over. We use our detailed research to defend your price during the appraisal process. If an appraiser questions the value, we provide the hard evidence and local context they need to see the full picture.
The Jose Cordova Difference
We believe in honest guidance that prioritizes your equity over a quick transaction. Our roots run deep in Orange, San Bernardino, and Riverside Counties. We live and work in these neighborhoods, giving us a “street-level” perspective that national websites simply lack. This no-nonsense approach extends to our work with buyers and those looking for real estate investment in the Inland Empire. We tell you the truth about what a property is worth, even if it’s not what you expected to hear. Accuracy and integrity are our highest priorities.
Ready for Your Professional CMA?
A personalized home value consultation is about more than just a report. It’s a strategy session. We look at your home’s unique upgrades and compare them to the current demand from local buyers. One of our biggest strengths is our bilingual support. By marketing your property in both English and Spanish, we tap into a much larger buyer pool in Southern California’s diverse market. This inclusive approach ensures your home gets maximum exposure during its time on the market, which currently averages 43 days. If you’re specifically trying to understand what is my home worth Temecula sellers need to know in 2026, our detailed local guide breaks down the micro-trends driving prices in that market. Don’t leave your biggest financial asset to a computer program. Get your free, expert-led Southern California home valuation today.
Take the Next Step Toward Your Home Sale
Navigating the 2026 housing market requires more than just looking at a median price. You need a strategy that accounts for tight inventory and shifting interest rates. By understanding the sales history of your neighborhood and applying precise adjustments, you move beyond guesswork. A true comparative market analysis California homeowners can rely on combines these hard facts with local intuition. This ensures you price your property to ignite interest rather than just to negotiate.
Jose Cordova brings over 15 years of expertise to your doorstep. We serve families across Riverside, San Bernardino, and Orange Counties with a focus on transparency and results. Our bilingual support in English and Spanish means your listing reaches the widest possible audience in Southern California. Don’t let your equity be determined by a computer algorithm that doesn’t know your street. Request Your Free Professional CMA from Jose Cordova and get the clarity you need to move forward. We are here to stand in your corner and protect your investment.
Frequently Asked Questions
Is a Comparative Market Analysis (CMA) the same as an appraisal?
A CMA is not the same as a formal appraisal. While both estimate value, an appraisal is a legal document required by lenders and performed by a licensed appraiser to secure financing. A comparative market analysis California agents provide is a strategic tool used to set a competitive listing price and understand current buyer demand. It focuses on market positioning rather than just bank requirements.
How much does a comparative market analysis cost in California?
Most real estate professionals provide a CMA as a complimentary service to homeowners considering a sale. It is often part of a standard residential property listing service or a home value estimate consultation. While some independent consultants might charge a fee for deep analytical reports, local agents typically offer this expertise to build trust and demonstrate their local market knowledge.
Can I do my own CMA without a real estate agent?
You can certainly perform a DIY version by researching public records and third-party websites. However, you’ll likely lack access to the real-time “hidden” data found in the Multiple Listing Service (MLS), such as seller concessions or specific property defects that lowered a sale price. A professional comparative market analysis California expert can fill these gaps with non-public information and local neighborhood intuition.
How many “comps” should be included in a professional CMA?
A solid analysis usually includes three to five recently sold properties that closely match your home’s features. It’s also helpful to include two or three active listings to see who you’re competing against right now. Including too many properties can muddy the data; using too few might not give an accurate picture of the current market range.
How far back should the sales history of a property go for a CMA?
We typically look at the last three to six months of sales history to ensure the data is relevant to the current economy. In a fast-moving market, sales from a year ago are often too outdated to be useful. If your neighborhood has very few sales, we may look further back but will apply adjustments to account for changes in interest rates and inventory levels.
What is the most important factor in a California CMA?
Location remains the most critical factor in any valuation. Even within the same zip code, being on a quiet street versus a busy thoroughfare can shift value by thousands of dollars. We prioritize properties within the same school district and neighborhood boundaries to ensure the comparison is as “apples-to-apples” as possible before adjusting for size or condition.
How often should I update my home’s market analysis?
It’s wise to update your analysis every three to six months if you’re actively planning to sell. Market conditions in Southern California can shift quickly due to new housing legislation or changes in buyer purchasing power. Staying current ensures your expectations align with what buyers are actually paying in the present moment rather than what happened last year.
Does a CMA include off-market or “pocket” listings?
A professional CMA can include off-market data if the agent has personal knowledge of those transactions through their professional network. Online algorithms completely miss these “pocket” listings because they aren’t recorded in public databases until much later. This “secret data” is often the key to understanding the true ceiling of a neighborhood’s value before it becomes public knowledge.
